Showing 1–20 of 219
-
Biodegradable Polymers in Various Environments According to Established Standards and Certification Schemes – Graphic (PDF, current version)
Sustainability & Health
1 Page
255 Downloads
255 Downloads
2026-05
FREE
Free Shipping255
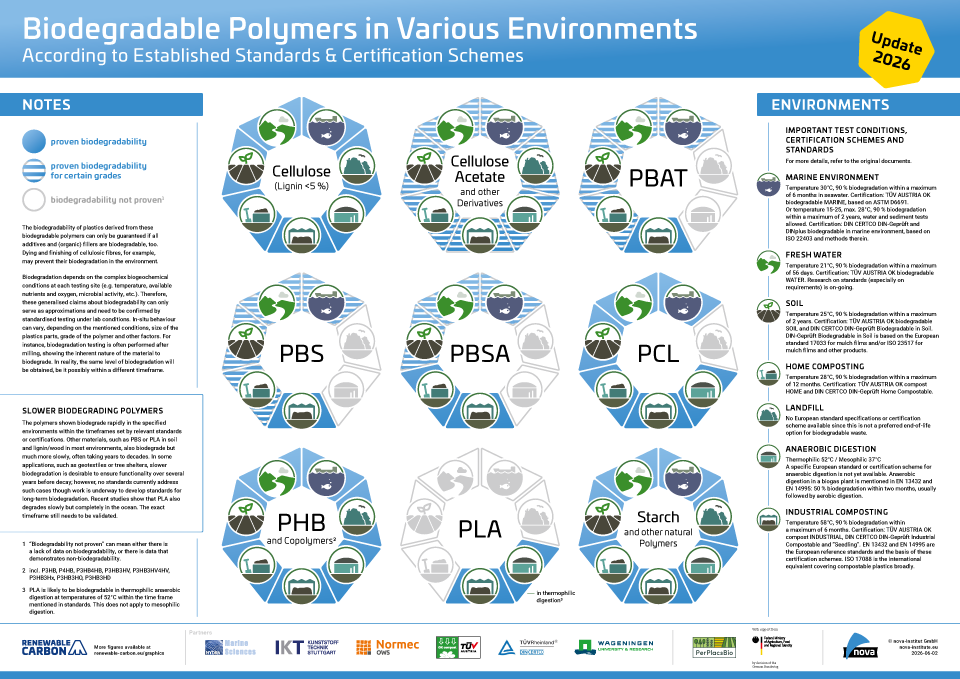
DownloadsFourth update of the well-known poster showing biodegradable polymers in different environments according to established standards and certification schemes. This update has been done within the PerPlacsBio project. The project is funded by the Fachagentur für Nachwachsende Rohstoffe (FNR) in Germany under the “Nachhaltige Erneuerbare Ressourcen” funding program.
Beginning of 2026, the expert group exchanged about the latest scientific evidence in the field of biodegradable polymers in order to make meaningful changes to the poster. The generic classification on the poster is only supported by tests performed in the context of certification. Therefore, the expert group has decided to include „biodegradability for certain grades“ of PBSA, PBS and PBAT in additional environments, including soil, freshwater and marine conditions, as well as home composting for PBS. Additionally, more precise explanations of the norms used in composting and marine biodegradation have been added, as well as clearer definitions of ‘biodegradability not proven’ and ‘slower biodegrading polymers’.
-
Biologisch abbaubare Polymere in versch. Umgebungen gemäß anerkannten Normen und Zertifizierungssystemen – Graphik (PNG, aktuelle Version)
Sustainability & Health
1 Page
34 Downloads
34 Downloads
2026-05
FREE
Free Shipping34
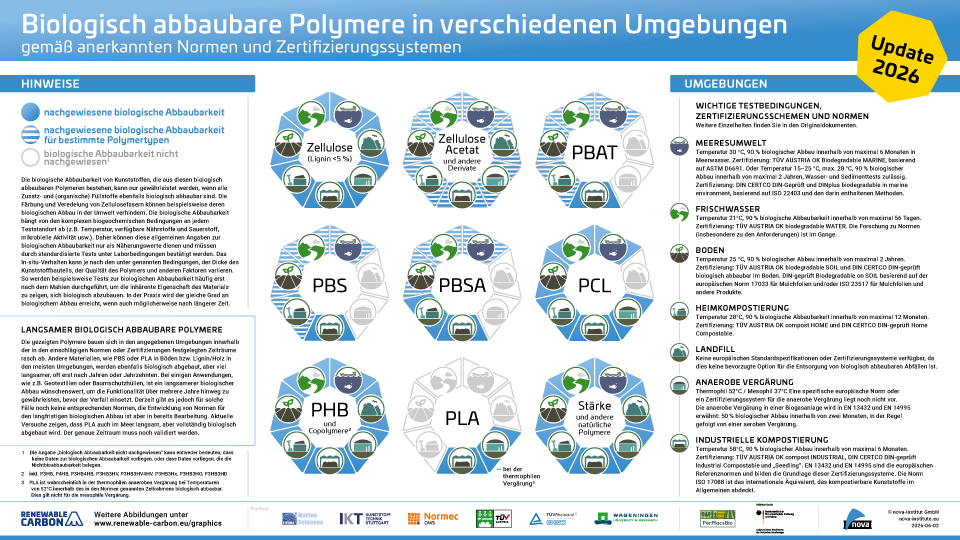
DownloadsVierte Aktualisierung des bekannten Posters, das biologisch abbaubare Polymere in verschiedenen Umgebungen gemäß etablierten Normen und Zertifizierungssystemen darstellt. Diese Aktualisierung erfolgte im Rahmen des PerPlacsBio-Projekts. Das Projekt wird von der Fachagentur für Nachwachsende Rohstoffe (FNR) in Deutschland im Rahmen des Förderprogramms „Nachhaltige Erneuerbare Ressourcen“ finanziert.
Anfang 2026 tauschte sich die Expertengruppe über die neuesten wissenschaftlichen Erkenntnisse im Bereich biologisch abbaubarer Polymere aus, um sinnvolle Änderungen am Poster vorzunehmen. Die allgemeine Klassifizierung auf dem Poster stützt sich ausschließlich auf Tests, die im Rahmen der Zertifizierung durchgeführt wurden. Daher hat die Expertengruppe beschlossen, die „biologische Abbaubarkeit für bestimmte Polymertypen“ von PBSA, PBS und PBAT in weiteren Umgebungen, darunter Boden, Süßwasser und Meeresbedingungen, sowie die Heimkompostierung für PBS aufzunehmen. Darüber hinaus wurden präzisere Erläuterungen zu den bei der Kompostierung und der marinen biologischen Abbaubarkeit verwendeten Normen hinzugefügt sowie klarere Definitionen für „biologische Abbaubarkeit nicht nachgewiesen“ und „langsamer biologisch abbaubare Polymere“.
-
Biologisch abbaubare Polymere in versch. Umgebungen gemäß anerkannten Normen und Zertifizierungssystemen – Graphik (PDF, aktuelle Version)
Sustainability & Health
1 Page
100 Downloads 100 Downloads
2026-05
FREE
Free Shipping100
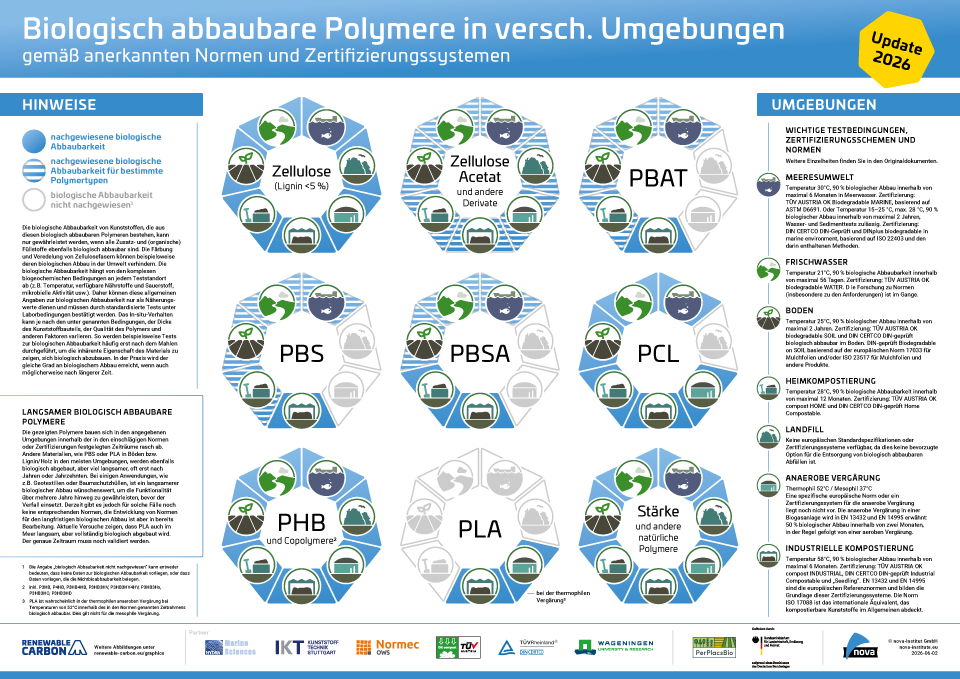
DownloadsVierte Aktualisierung des bekannten Posters, das biologisch abbaubare Polymere in verschiedenen Umgebungen gemäß etablierten Normen und Zertifizierungssystemen darstellt. Diese Aktualisierung erfolgte im Rahmen des PerPlacsBio-Projekts. Das Projekt wird von der Fachagentur für Nachwachsende Rohstoffe (FNR) in Deutschland im Rahmen des Förderprogramms „Nachhaltige Erneuerbare Ressourcen“ finanziert.
Anfang 2026 tauschte sich die Expertengruppe über die neuesten wissenschaftlichen Erkenntnisse im Bereich biologisch abbaubarer Polymere aus, um sinnvolle Änderungen am Poster vorzunehmen. Die allgemeine Klassifizierung auf dem Poster stützt sich ausschließlich auf Tests, die im Rahmen der Zertifizierung durchgeführt wurden. Daher hat die Expertengruppe beschlossen, die „biologische Abbaubarkeit für bestimmte Polymertypen“ von PBSA, PBS und PBAT in weiteren Umgebungen, darunter Boden, Süßwasser und Meeresbedingungen, sowie die Heimkompostierung für PBS aufzunehmen. Darüber hinaus wurden präzisere Erläuterungen zu den bei der Kompostierung und der marinen biologischen Abbaubarkeit verwendeten Normen hinzugefügt sowie klarere Definitionen für „biologische Abbaubarkeit nicht nachgewiesen“ und „langsamer biologisch abbaubare Polymere“.
-
Biodegradable Polymers in Various Environments According to Established Standards and Certification Schemes – Graphic (PNG, current version)
Sustainability & Health
1 Page
96 Downloads 96 Downloads
2026-05
FREE
Free Shipping96
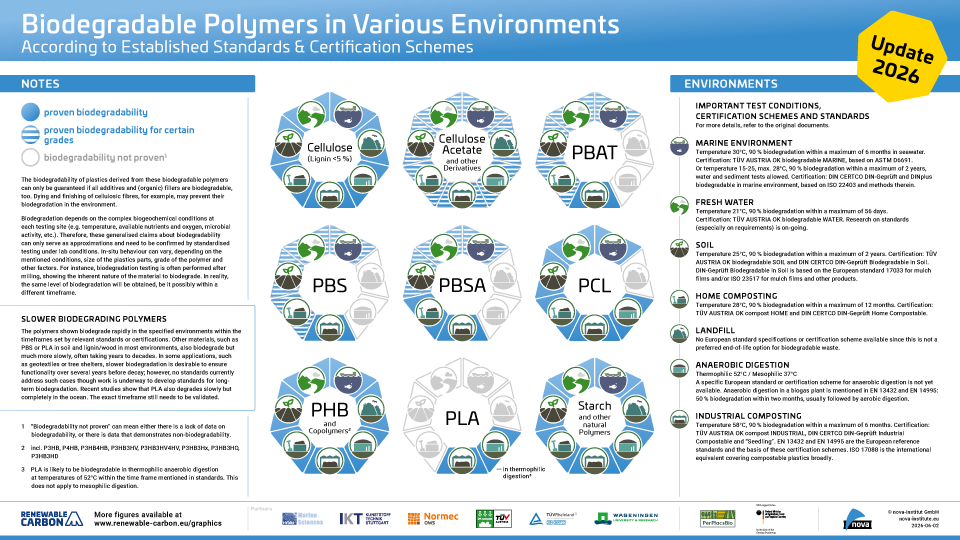
DownloadsFourth update of the well-known poster showing biodegradable polymers in different environments according to established standards and certification schemes. This update has been done within the PerPlacsBio project. The project is funded by the Fachagentur für Nachwachsende Rohstoffe (FNR) in Germany under the “Nachhaltige Erneuerbare Ressourcen” funding program.
Beginning of 2026, the expert group exchanged about the latest scientific evidence in the field of biodegradable polymers in order to make meaningful changes to the poster. The generic classification on the poster is only supported by tests performed in the context of certification. Therefore, the expert group has decided to include „biodegradability for certain grades“ of PBSA, PBS and PBAT in additional environments, including soil, freshwater and marine conditions, as well as home composting for PBS. Additionally, more precise explanations of the norms used in composting and marine biodegradation have been added, as well as clearer definitions of ‘biodegradability not proven’ and ‘slower biodegrading polymers’.
-
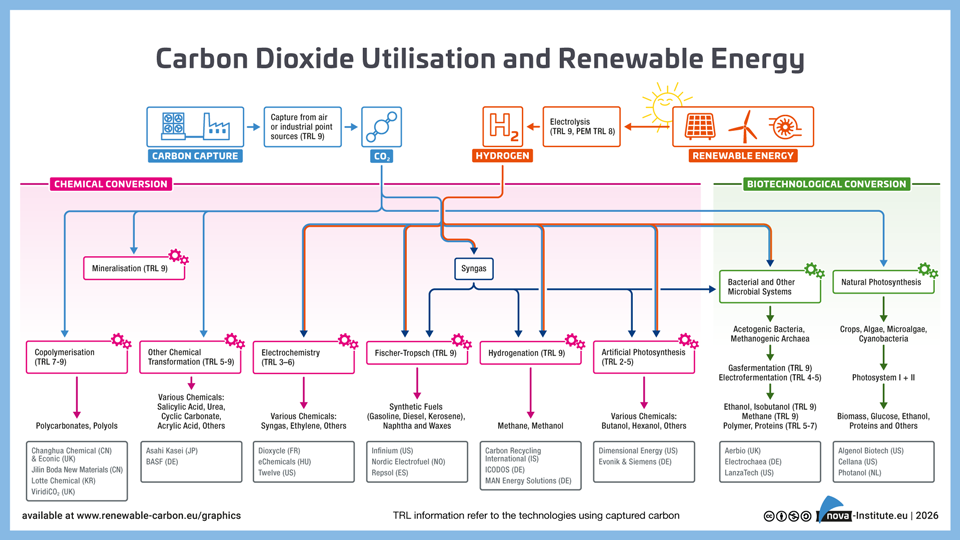
Carbon Dioxide Utilisation and Renewable Energy − Graphic (PNG)
Markets & Economy, Technology
1 Page
97 Downloads 97 Downloads
2026-02
FREE
Free Shipping97
Downloads -
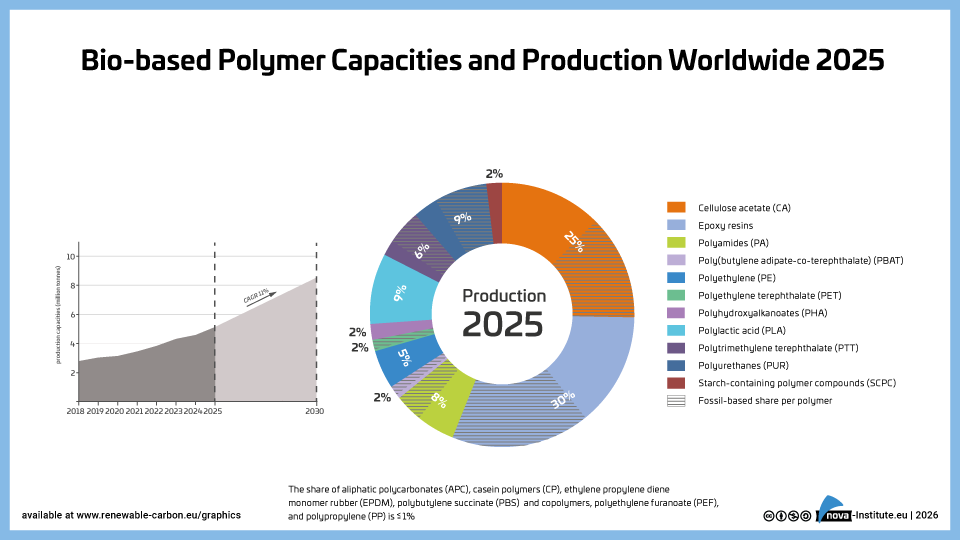
Bio-based Polymer Capacities and Production Worldwide 2025 (PNG)
Markets & Economy
1 Page
59 Downloads 59 Downloads
2026-02
FREE
Free Shipping59
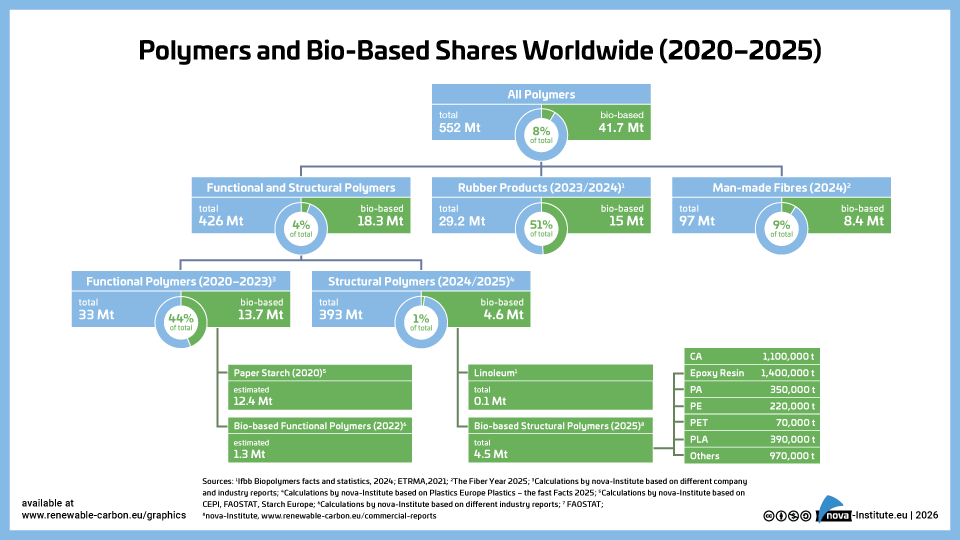
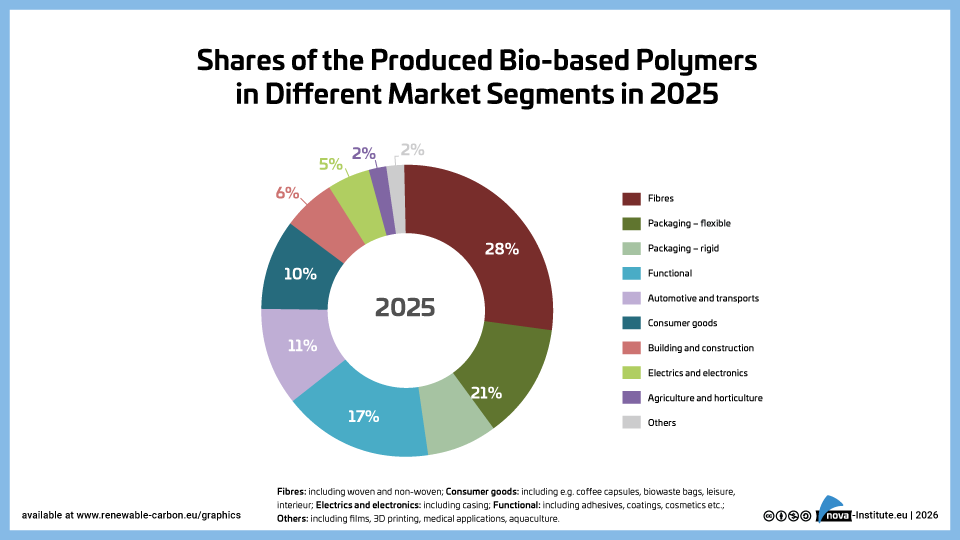
DownloadsThe new high-level report “Bio‑based Building Blocks and Polymers – Global Capacities, Production and Trends 2025–2030”, compiled by the international biopolymer expert group of the nova-Institute, provides an overview of the capacities and production data of 17 commercially available bio‑based building blocks and polymers in 2025, along with a forecast for 2030. Detailed market data is available via individual workshops and webinars with the biopolymer experts. This data includes capacity development from 2018 to 2030, production data for the years 2024 and 2025, and analyses of market developments per building block, polymer and producers, as well as a statistical analysis of “Mass Balance and Attribution (MBA)” products available worldwide.
2025 was a solid year for bio-based polymers, with an expected overall CAGR of 11 % to 2030 and an average capacity utilisation rate of 86 %. Overall, bio-based non-biodegradable polymers have larger installed capacities and higher utilisation rates than bio-based biodegradable polymers. While 58 % of the total installed capacities are from bio-based non-biodegradable polymers, 42 % are bio-based biodegradable polymers. Bio-based non-biodegradable have an average utilisation rate of 90 % whereas bio-based biodegradable polymers have an average utilisation rate of 81 %. The expected CAGR for both, bio-based non-biodegradable and biodegradable is similar with 10 % and 11 %, respectively.
Epoxy resin and PUR production is growing moderately at 9 and 8 %, respectively, while PE and PP are increasing by 17 % and 94 %. Also, capacities for the biodegradables PHA and PLA are expected to increase until 2030 by 49 % and 16 %, respectively. Commercial newcomers such as casein polymers and PEF have increased production capacity and are expected to continue to grow significantly until 2030.
DOI No.: https://doi.org/10.52548/PILO4285
-
59 Downloads
2026-02
FREE
Free Shipping59
DownloadsThe new high-level report “Bio‑based Building Blocks and Polymers – Global Capacities, Production and Trends 2025–2030”, compiled by the international biopolymer expert group of the nova-Institute, provides an overview of the capacities and production data of 17 commercially available bio‑based building blocks and polymers in 2025, along with a forecast for 2030. Detailed market data is available via individual workshops and webinars with the biopolymer experts. This data includes capacity development from 2018 to 2030, production data for the years 2024 and 2025, and analyses of market developments per building block, polymer and producers, as well as a statistical analysis of “Mass Balance and Attribution (MBA)” products available worldwide.
2025 was a solid year for bio-based polymers, with an expected overall CAGR of 11 % to 2030 and an average capacity utilisation rate of 86 %. Overall, bio-based non-biodegradable polymers have larger installed capacities and higher utilisation rates than bio-based biodegradable polymers. While 58 % of the total installed capacities are from bio-based non-biodegradable polymers, 42 % are bio-based biodegradable polymers. Bio-based non-biodegradable have an average utilisation rate of 90 % whereas bio-based biodegradable polymers have an average utilisation rate of 81 %. The expected CAGR for both, bio-based non-biodegradable and biodegradable is similar with 10 % and 11 %, respectively.
Epoxy resin and PUR production is growing moderately at 9 and 8 %, respectively, while PE and PP are increasing by 17 % and 94 %. Also, capacities for the biodegradables PHA and PLA are expected to increase until 2030 by 49 % and 16 %, respectively. Commercial newcomers such as casein polymers and PEF have increased production capacity and are expected to continue to grow significantly until 2030.
DOI No.: https://doi.org/10.52548/PILO4285
-
71 Downloads
2026-02
FREE
Free Shipping71
DownloadsThe new high-level report “Bio‑based Building Blocks and Polymers – Global Capacities, Production and Trends 2025–2030”, compiled by the international biopolymer expert group of the nova-Institute, provides an overview of the capacities and production data of 17 commercially available bio‑based building blocks and polymers in 2025, along with a forecast for 2030. Detailed market data is available via individual workshops and webinars with the biopolymer experts. This data includes capacity development from 2018 to 2030, production data for the years 2024 and 2025, and analyses of market developments per building block, polymer and producers, as well as a statistical analysis of “Mass Balance and Attribution (MBA)” products available worldwide.
2025 was a solid year for bio-based polymers, with an expected overall CAGR of 11 % to 2030 and an average capacity utilisation rate of 86 %. Overall, bio-based non-biodegradable polymers have larger installed capacities and higher utilisation rates than bio-based biodegradable polymers. While 58 % of the total installed capacities are from bio-based non-biodegradable polymers, 42 % are bio-based biodegradable polymers. Bio-based non-biodegradable have an average utilisation rate of 90 % whereas bio-based biodegradable polymers have an average utilisation rate of 81 %. The expected CAGR for both, bio-based non-biodegradable and biodegradable is similar with 10 % and 11 %, respectively.
Epoxy resin and PUR production is growing moderately at 9 and 8 %, respectively, while PE and PP are increasing by 17 % and 94 %. Also, capacities for the biodegradables PHA and PLA are expected to increase until 2030 by 49 % and 16 %, respectively. Commercial newcomers such as casein polymers and PEF have increased production capacity and are expected to continue to grow significantly until 2030.
DOI No.: https://doi.org/10.52548/PILO4285
-
56 Downloads
2026-02
FREE
Free Shipping56
DownloadsThe new high-level report “Bio‑based Building Blocks and Polymers – Global Capacities, Production and Trends 2025–2030”, compiled by the international biopolymer expert group of the nova-Institute, provides an overview of the capacities and production data of 17 commercially available bio‑based building blocks and polymers in 2025, along with a forecast for 2030. Detailed market data is available via individual workshops and webinars with the biopolymer experts. This data includes capacity development from 2018 to 2030, production data for the years 2024 and 2025, and analyses of market developments per building block, polymer and producers, as well as a statistical analysis of “Mass Balance and Attribution (MBA)” products available worldwide.
2025 was a solid year for bio-based polymers, with an expected overall CAGR of 11 % to 2030 and an average capacity utilisation rate of 86 %. Overall, bio-based non-biodegradable polymers have larger installed capacities and higher utilisation rates than bio-based biodegradable polymers. While 58 % of the total installed capacities are from bio-based non-biodegradable polymers, 42 % are bio-based biodegradable polymers. Bio-based non-biodegradable have an average utilisation rate of 90 % whereas bio-based biodegradable polymers have an average utilisation rate of 81 %. The expected CAGR for both, bio-based non-biodegradable and biodegradable is similar with 10 % and 11 %, respectively.
Epoxy resin and PUR production is growing moderately at 9 and 8 %, respectively, while PE and PP are increasing by 17 % and 94 %. Also, capacities for the biodegradables PHA and PLA are expected to increase until 2030 by 49 % and 16 %, respectively. Commercial newcomers such as casein polymers and PEF have increased production capacity and are expected to continue to grow significantly until 2030.
DOI No.: https://doi.org/10.52548/PILO4285
-
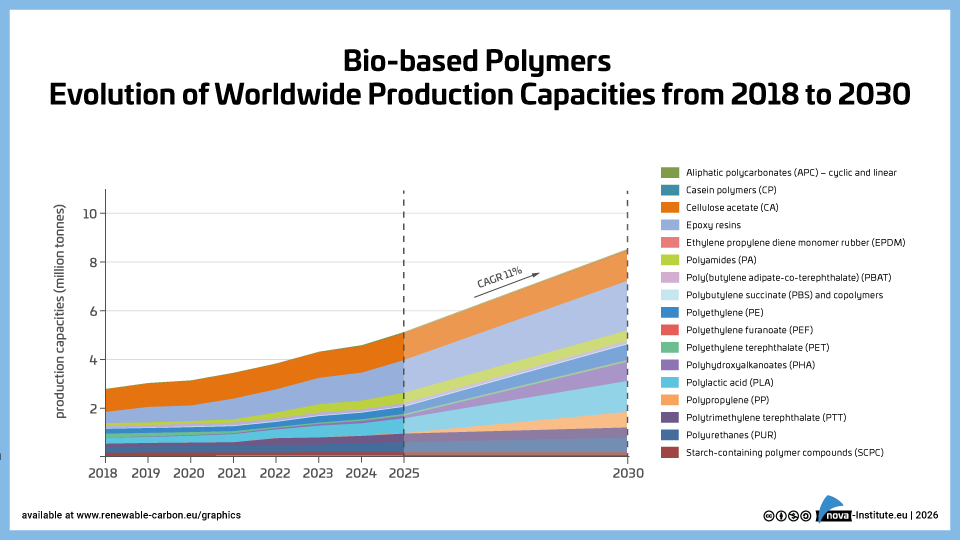
Bio-based polymers – Evolution of worldwide production capacities from 2018 to 2030 (PNG)
Markets & Economy
1 Page
64 Downloads 64 Downloads
2026-02
FREE
Free Shipping64
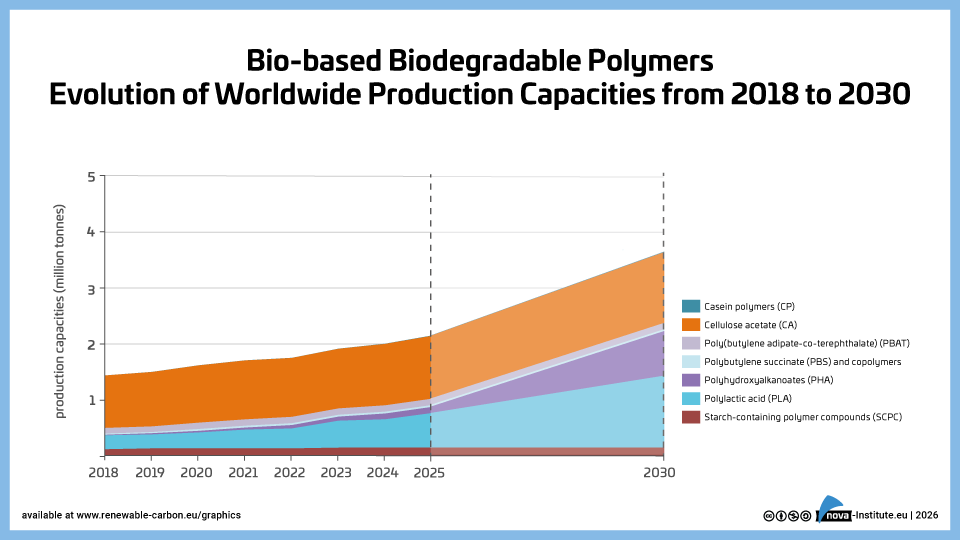
DownloadsThe new high-level report “Bio‑based Building Blocks and Polymers – Global Capacities, Production and Trends 2025–2030”, compiled by the international biopolymer expert group of the nova-Institute, provides an overview of the capacities and production data of 17 commercially available bio‑based building blocks and polymers in 2025, along with a forecast for 2030. Detailed market data is available via individual workshops and webinars with the biopolymer experts. This data includes capacity development from 2018 to 2030, production data for the years 2024 and 2025, and analyses of market developments per building block, polymer and producers, as well as a statistical analysis of “Mass Balance and Attribution (MBA)” products available worldwide.
2025 was a solid year for bio-based polymers, with an expected overall CAGR of 11 % to 2030 and an average capacity utilisation rate of 86 %. Overall, bio-based non-biodegradable polymers have larger installed capacities and higher utilisation rates than bio-based biodegradable polymers. While 58 % of the total installed capacities are from bio-based non-biodegradable polymers, 42 % are bio-based biodegradable polymers. Bio-based non-biodegradable have an average utilisation rate of 90 % whereas bio-based biodegradable polymers have an average utilisation rate of 81 %. The expected CAGR for both, bio-based non-biodegradable and biodegradable is similar with 10 % and 11 %, respectively.
Epoxy resin and PUR production is growing moderately at 9 and 8 %, respectively, while PE and PP are increasing by 17 % and 94 %. Also, capacities for the biodegradables PHA and PLA are expected to increase until 2030 by 49 % and 16 %, respectively. Commercial newcomers such as casein polymers and PEF have increased production capacity and are expected to continue to grow significantly until 2030.
DOI No.: https://doi.org/10.52548/PILO4285
-
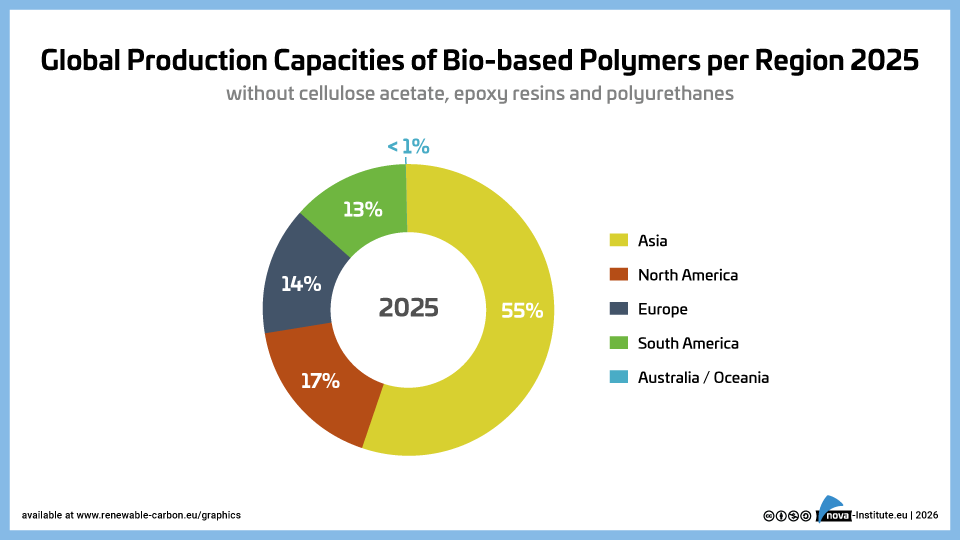
Global Production Capacities of Bio-based Polymers per region 2025 (PNG)
Markets & Economy
1 Page
40 Downloads 40 Downloads
2026-02
FREE
Free Shipping40
DownloadsThe new high-level report “Bio‑based Building Blocks and Polymers – Global Capacities, Production and Trends 2025–2030”, compiled by the international biopolymer expert group of the nova-Institute, provides an overview of the capacities and production data of 17 commercially available bio‑based building blocks and polymers in 2025, along with a forecast for 2030. Detailed market data is available via individual workshops and webinars with the biopolymer experts. This data includes capacity development from 2018 to 2030, production data for the years 2024 and 2025, and analyses of market developments per building block, polymer and producers, as well as a statistical analysis of “Mass Balance and Attribution (MBA)” products available worldwide.
2025 was a solid year for bio-based polymers, with an expected overall CAGR of 11 % to 2030 and an average capacity utilisation rate of 86 %. Overall, bio-based non-biodegradable polymers have larger installed capacities and higher utilisation rates than bio-based biodegradable polymers. While 58 % of the total installed capacities are from bio-based non-biodegradable polymers, 42 % are bio-based biodegradable polymers. Bio-based non-biodegradable have an average utilisation rate of 90 % whereas bio-based biodegradable polymers have an average utilisation rate of 81 %. The expected CAGR for both, bio-based non-biodegradable and biodegradable is similar with 10 % and 11 %, respectively.
Epoxy resin and PUR production is growing moderately at 9 and 8 %, respectively, while PE and PP are increasing by 17 % and 94 %. Also, capacities for the biodegradables PHA and PLA are expected to increase until 2030 by 49 % and 16 %, respectively. Commercial newcomers such as casein polymers and PEF have increased production capacity and are expected to continue to grow significantly until 2030.
DOI No.: https://doi.org/10.52548/PILO4285
-
Bio-based non biodegradable polymers Evolution of Capacities (PNG)
Markets & Economy
1 Page
27 Downloads 27 Downloads
2026-02
FREE
Free Shipping27
DownloadsThe new high-level report “Bio‑based Building Blocks and Polymers – Global Capacities, Production and Trends 2025–2030”, compiled by the international biopolymer expert group of the nova-Institute, provides an overview of the capacities and production data of 17 commercially available bio‑based building blocks and polymers in 2025, along with a forecast for 2030. Detailed market data is available via individual workshops and webinars with the biopolymer experts. This data includes capacity development from 2018 to 2030, production data for the years 2024 and 2025, and analyses of market developments per building block, polymer and producers, as well as a statistical analysis of “Mass Balance and Attribution (MBA)” products available worldwide.
2025 was a solid year for bio-based polymers, with an expected overall CAGR of 11 % to 2030 and an average capacity utilisation rate of 86 %. Overall, bio-based non-biodegradable polymers have larger installed capacities and higher utilisation rates than bio-based biodegradable polymers. While 58 % of the total installed capacities are from bio-based non-biodegradable polymers, 42 % are bio-based biodegradable polymers. Bio-based non-biodegradable have an average utilisation rate of 90 % whereas bio-based biodegradable polymers have an average utilisation rate of 81 %. The expected CAGR for both, bio-based non-biodegradable and biodegradable is similar with 10 % and 11 %, respectively.
Epoxy resin and PUR production is growing moderately at 9 and 8 %, respectively, while PE and PP are increasing by 17 % and 94 %. Also, capacities for the biodegradables PHA and PLA are expected to increase until 2030 by 49 % and 16 %, respectively. Commercial newcomers such as casein polymers and PEF have increased production capacity and are expected to continue to grow significantly until 2030.
DOI No.: https://doi.org/10.52548/PILO4285
-
Bio-based biodegradable polymers-Evolution Capacities to 2030 (PNG)
Markets & Economy
1 Page
47 Downloads 47 Downloads
2026-02
FREE
Free Shipping47
DownloadsThe new high-level report “Bio‑based Building Blocks and Polymers – Global Capacities, Production and Trends 2025–2030”, compiled by the international biopolymer expert group of the nova-Institute, provides an overview of the capacities and production data of 17 commercially available bio‑based building blocks and polymers in 2025, along with a forecast for 2030. Detailed market data is available via individual workshops and webinars with the biopolymer experts. This data includes capacity development from 2018 to 2030, production data for the years 2024 and 2025, and analyses of market developments per building block, polymer and producers, as well as a statistical analysis of “Mass Balance and Attribution (MBA)” products available worldwide.
2025 was a solid year for bio-based polymers, with an expected overall CAGR of 11 % to 2030 and an average capacity utilisation rate of 86 %. Overall, bio-based non-biodegradable polymers have larger installed capacities and higher utilisation rates than bio-based biodegradable polymers. While 58 % of the total installed capacities are from bio-based non-biodegradable polymers, 42 % are bio-based biodegradable polymers. Bio-based non-biodegradable have an average utilisation rate of 90 % whereas bio-based biodegradable polymers have an average utilisation rate of 81 %. The expected CAGR for both, bio-based non-biodegradable and biodegradable is similar with 10 % and 11 %, respectively.
Epoxy resin and PUR production is growing moderately at 9 and 8 %, respectively, while PE and PP are increasing by 17 % and 94 %. Also, capacities for the biodegradables PHA and PLA are expected to increase until 2030 by 49 % and 16 %, respectively. Commercial newcomers such as casein polymers and PEF have increased production capacity and are expected to continue to grow significantly until 2030.
DOI No.: https://doi.org/10.52548/PILO4285
-
Bio-based building blocks – Evolution of capacities to 2030 (PNG)
Markets & Economy
1 Page
36 Downloads 36 Downloads
2026-02
FREE
Free Shipping36
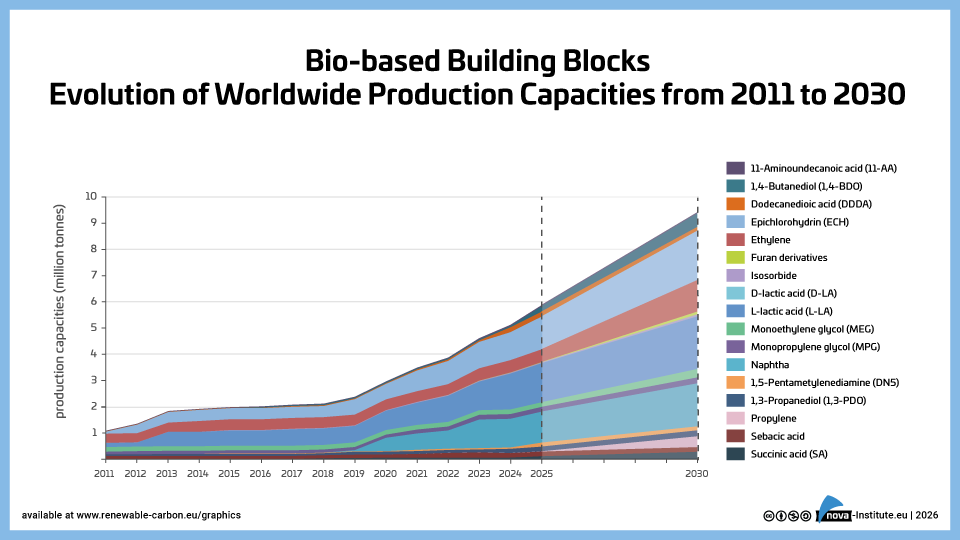
DownloadsThe new high-level report “Bio‑based Building Blocks and Polymers – Global Capacities, Production and Trends 2025–2030”, compiled by the international biopolymer expert group of the nova-Institute, provides an overview of the capacities and production data of 17 commercially available bio‑based building blocks and polymers in 2025, along with a forecast for 2030. Detailed market data is available via individual workshops and webinars with the biopolymer experts. This data includes capacity development from 2018 to 2030, production data for the years 2024 and 2025, and analyses of market developments per building block, polymer and producers, as well as a statistical analysis of “Mass Balance and Attribution (MBA)” products available worldwide.
2025 was a solid year for bio-based polymers, with an expected overall CAGR of 11 % to 2030 and an average capacity utilisation rate of 86 %. Overall, bio-based non-biodegradable polymers have larger installed capacities and higher utilisation rates than bio-based biodegradable polymers. While 58 % of the total installed capacities are from bio-based non-biodegradable polymers, 42 % are bio-based biodegradable polymers. Bio-based non-biodegradable have an average utilisation rate of 90 % whereas bio-based biodegradable polymers have an average utilisation rate of 81 %. The expected CAGR for both, bio-based non-biodegradable and biodegradable is similar with 10 % and 11 %, respectively.
Epoxy resin and PUR production is growing moderately at 9 and 8 %, respectively, while PE and PP are increasing by 17 % and 94 %. Also, capacities for the biodegradables PHA and PLA are expected to increase until 2030 by 49 % and 16 %, respectively. Commercial newcomers such as casein polymers and PEF have increased production capacity and are expected to continue to grow significantly until 2030.
DOI No.: https://doi.org/10.52548/PILO4285
-
102 Downloads
2026-02
FREE
Free Shipping102
DownloadsThe new high-level report “Bio‑based Building Blocks and Polymers – Global Capacities, Production and Trends 2025–2030”, compiled by the international biopolymer expert group of the nova-Institute, provides an overview of the capacities and production data of 17 commercially available bio‑based building blocks and polymers in 2025, along with a forecast for 2030. Detailed market data is available via individual workshops and webinars with the biopolymer experts. This data includes capacity development from 2018 to 2030, production data for the years 2024 and 2025, and analyses of market developments per building block, polymer and producers, as well as a statistical analysis of “Mass Balance and Attribution (MBA)” products available worldwide.
2025 was a solid year for bio-based polymers, with an expected overall CAGR of 11 % to 2030 and an average capacity utilisation rate of 86 %. Overall, bio-based non-biodegradable polymers have larger installed capacities and higher utilisation rates than bio-based biodegradable polymers. While 58 % of the total installed capacities are from bio-based non-biodegradable polymers, 42 % are bio-based biodegradable polymers. Bio-based non-biodegradable have an average utilisation rate of 90 % whereas bio-based biodegradable polymers have an average utilisation rate of 81 %. The expected CAGR for both, bio-based non-biodegradable and biodegradable is similar with 10 % and 11 %, respectively.
Epoxy resin and PUR production is growing moderately at 9 and 8 %, respectively, while PE and PP are increasing by 17 % and 94 %. Also, capacities for the biodegradables PHA and PLA are expected to increase until 2030 by 49 % and 16 %, respectively. Commercial newcomers such as casein polymers and PEF have increased production capacity and are expected to continue to grow significantly until 2030.
DOI No.: https://doi.org/10.52548/PILO4285
-
32 Downloads
2025-12
FREE
Free Shipping32
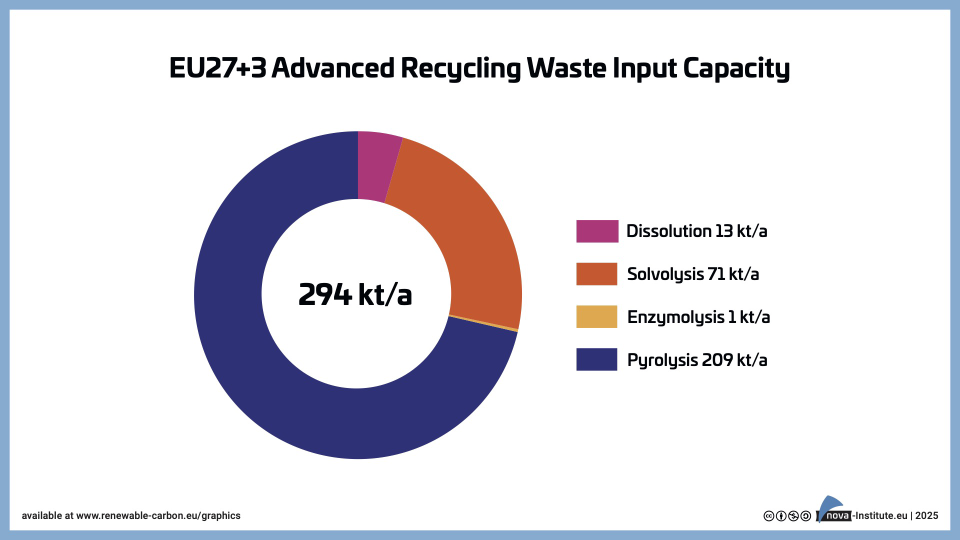
DownloadsInstalled input capacities for different advanced recycling technologies in EU27+3 for the year 2024.
-
26 Downloads
2025-12
FREE
Free Shipping26
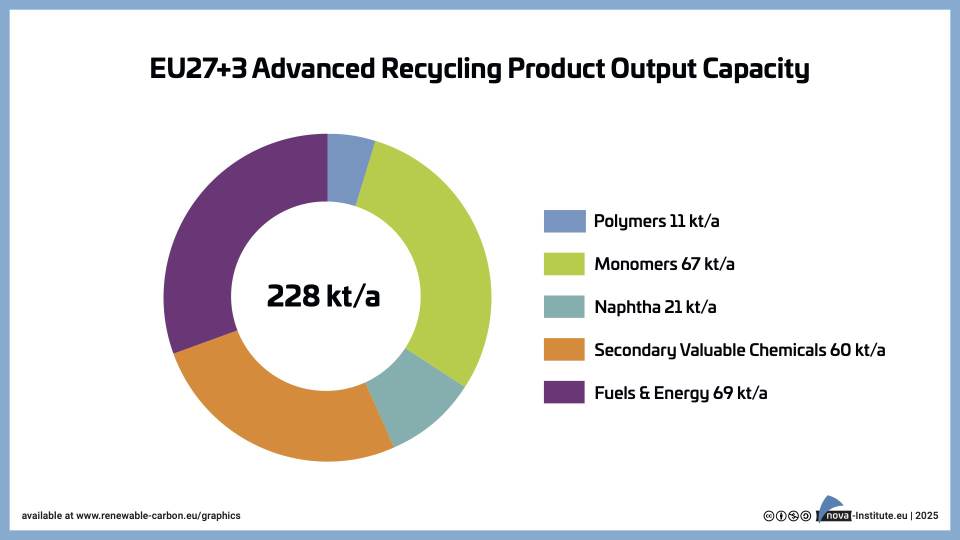
DownloadsInstalled advanced recycling output capacities for different products in EU27+3 for the year 2024.
-
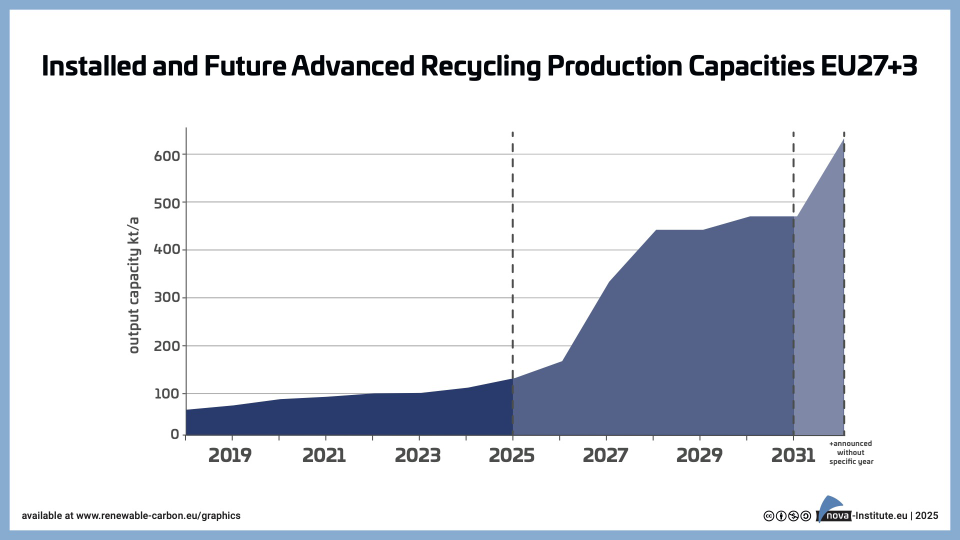
Installed and Future Advanced Recycling Production Capacities between 2018-2031 for EU27+3 (JPG)
Technology
1 Page
48 Downloads 48 Downloads
2025-12
FREE
Free Shipping48
DownloadsInstalled and future production capacities for advanced recycling of products in the EU27+3 that can be used to produce new polymers and plastics.
-
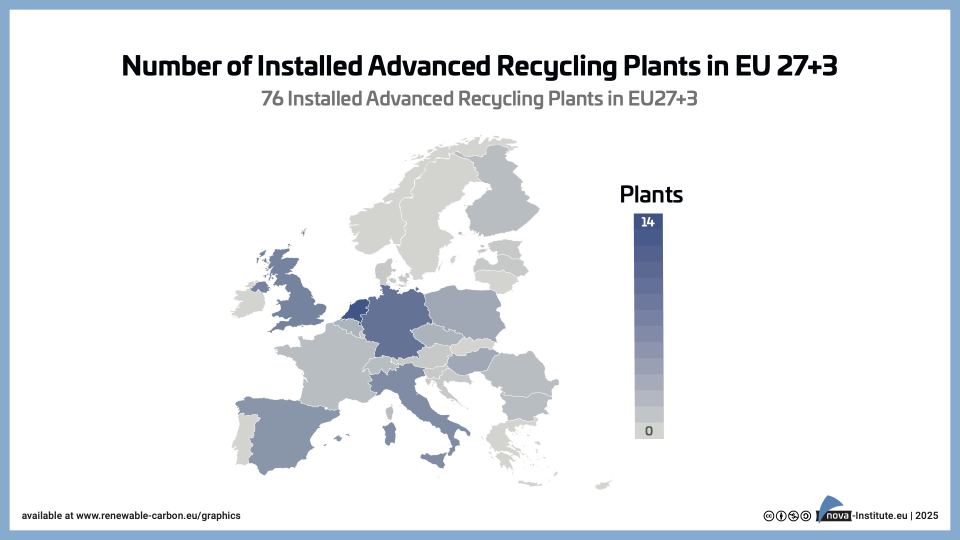
Number of advanced recycling facilities installed in the EU-27+3 in 2024 (JPG)
Technology
1 Page
31 Downloads 31 Downloads
2025-12
FREE
Free Shipping31
DownloadsOverview showing all installed and running advanced recycling plants in the EU27+3 in 2024.
-
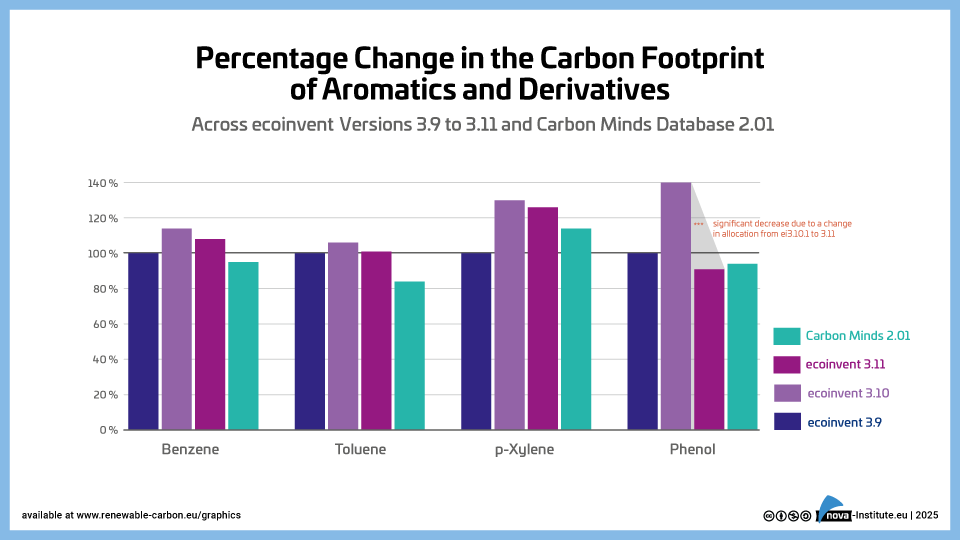
Percentage Change in the Carbon Footprint of Aromatics and Derivatives (PNG)
Sustainability & Health
1 Page
16 Downloads 16 Downloads
2025-10
FREE
Free Shipping16
Downloads